Is Your Hospital Closer to a Dunkin or Starbucks? (MA edition)
May 13, 2018
This post is inspired by #tidytuesday. Coffee is the life force for many healthcare workers. Here too, the age old question arises: Dunkin or Starbucks? Sometimes, it just comes down to proximity. We need coffee and we need it now! So, I decided to see what chain was closest to each hospital in Massachusetts.
Data Sources
The Packages
library(tidyverse)
library(tidycensus)
library(jsonlite)
library(geosphere)
The Data
starb = read.csv("directory.csv/directory.csv")
dfHosp = read.csv("Hospital_General_Information.csv")
dunks = read.csv("dunkin_donuts.csv")
The Wrangling
Filtering for Massachusetts locations only
starbMA = starbUS %>% filter(State.Province == "MA")
dfHospMA = dfHosp %>% filter(State == "MA")
dunksMA = dunks %>% filter(e_state == "MA")
Geocoding Hospital Location
Google provides a powerful geocoding API. More on this in a future post. The code may not be pretty, but it uses the hospital location obtain longitude and latitude.
dfHospMA$lat = NaN
dfHospMA$lon = NaN
dfHospMA$geo_address = NaN

for (i in 1:nrow(dfHospMA)) {
  print(i)
  dfLocation = paste0(dfHospMA$Address[i], ",", dfHospMA$City[i], ",", dfHospMA$State[i])
  dfLocation = gsub(' ','+',dfLocation)
  dfURL = paste0("https://maps.googleapis.com/maps/api/geocode/json?address=",dfLocation,"&key=",api_key)
  dfJSON = fromJSON(dfURL)
  dfHospMA$lat[i] = dfJSON$results$geometry$location$lat
  dfHospMA$lon[i] = dfJSON$results$geometry$location$lng
  dfHospMA$geo_address[i] = dfJSON$results$formatted_address
}
Just a few corrections for geocoding errors I found.
dfHospMA$lat[2] = 42.4842322
dfHospMA$lon[2]  = -71.204072

dfHospMA$lat[52] = 41.564962
dfHospMA$lon[52]  = -70.621126
Calcuting Distances
I am by no means an expert on calculating geospatial distances. However, from my initial reading, there are various formulas to calculate the straight line distance between 2 points. Here I use the distVincentyEllipsoid function from the geosphere package. So, I calculate the distance from each starbucks to each hospital and create a master dataframe with this data called final_df.
final_df = data.frame(org=NaN, dist = NaN, hospName = NaN, type = NaN)
temp_df = data.frame(org=NaN, dist = NaN, hospName = NaN, type = NaN)

for (i in 1:nrow(dfHospMA)) {
  for (j in 1:nrow(starbMA)) {
    x = distVincentyEllipsoid(c(starbMA$Longitude[j], starbMA$Latitude[j]), c(dfHospMA$lon[i], dfHospMA$lat[i]))
    temp_df$org = starbMA$Store.Number[j]
    temp_df$dist = x
    temp_df$hospName = dfHospMA$Hospital.Name[i]
    temp_df$type = "starbucks"
    final_df = rbind(final_df, temp_df)
    print(i)
    print(x)
    print("star")
  }
}

for (i in 1:nrow(dfHospMA)) {
  for (j in 1:nrow(dunksMA)) {
    x = distVincentyEllipsoid(c(dunksMA$loc_LONG_poly[j], dunksMA$loc_LAT_poly[j]), c(dfHospMA$lon[i], dfHospMA$lat[i]))
    temp_df$org = dunksMA$id[j]
    temp_df$dist = x
    temp_df$hospName = dfHospMA$Hospital.Name[i]
    final_df = rbind(final_df, temp_df)
    temp_df$type = "dunkin"
    print(i)
    print(x)
    print("dunks")
  }
}
The Visualization
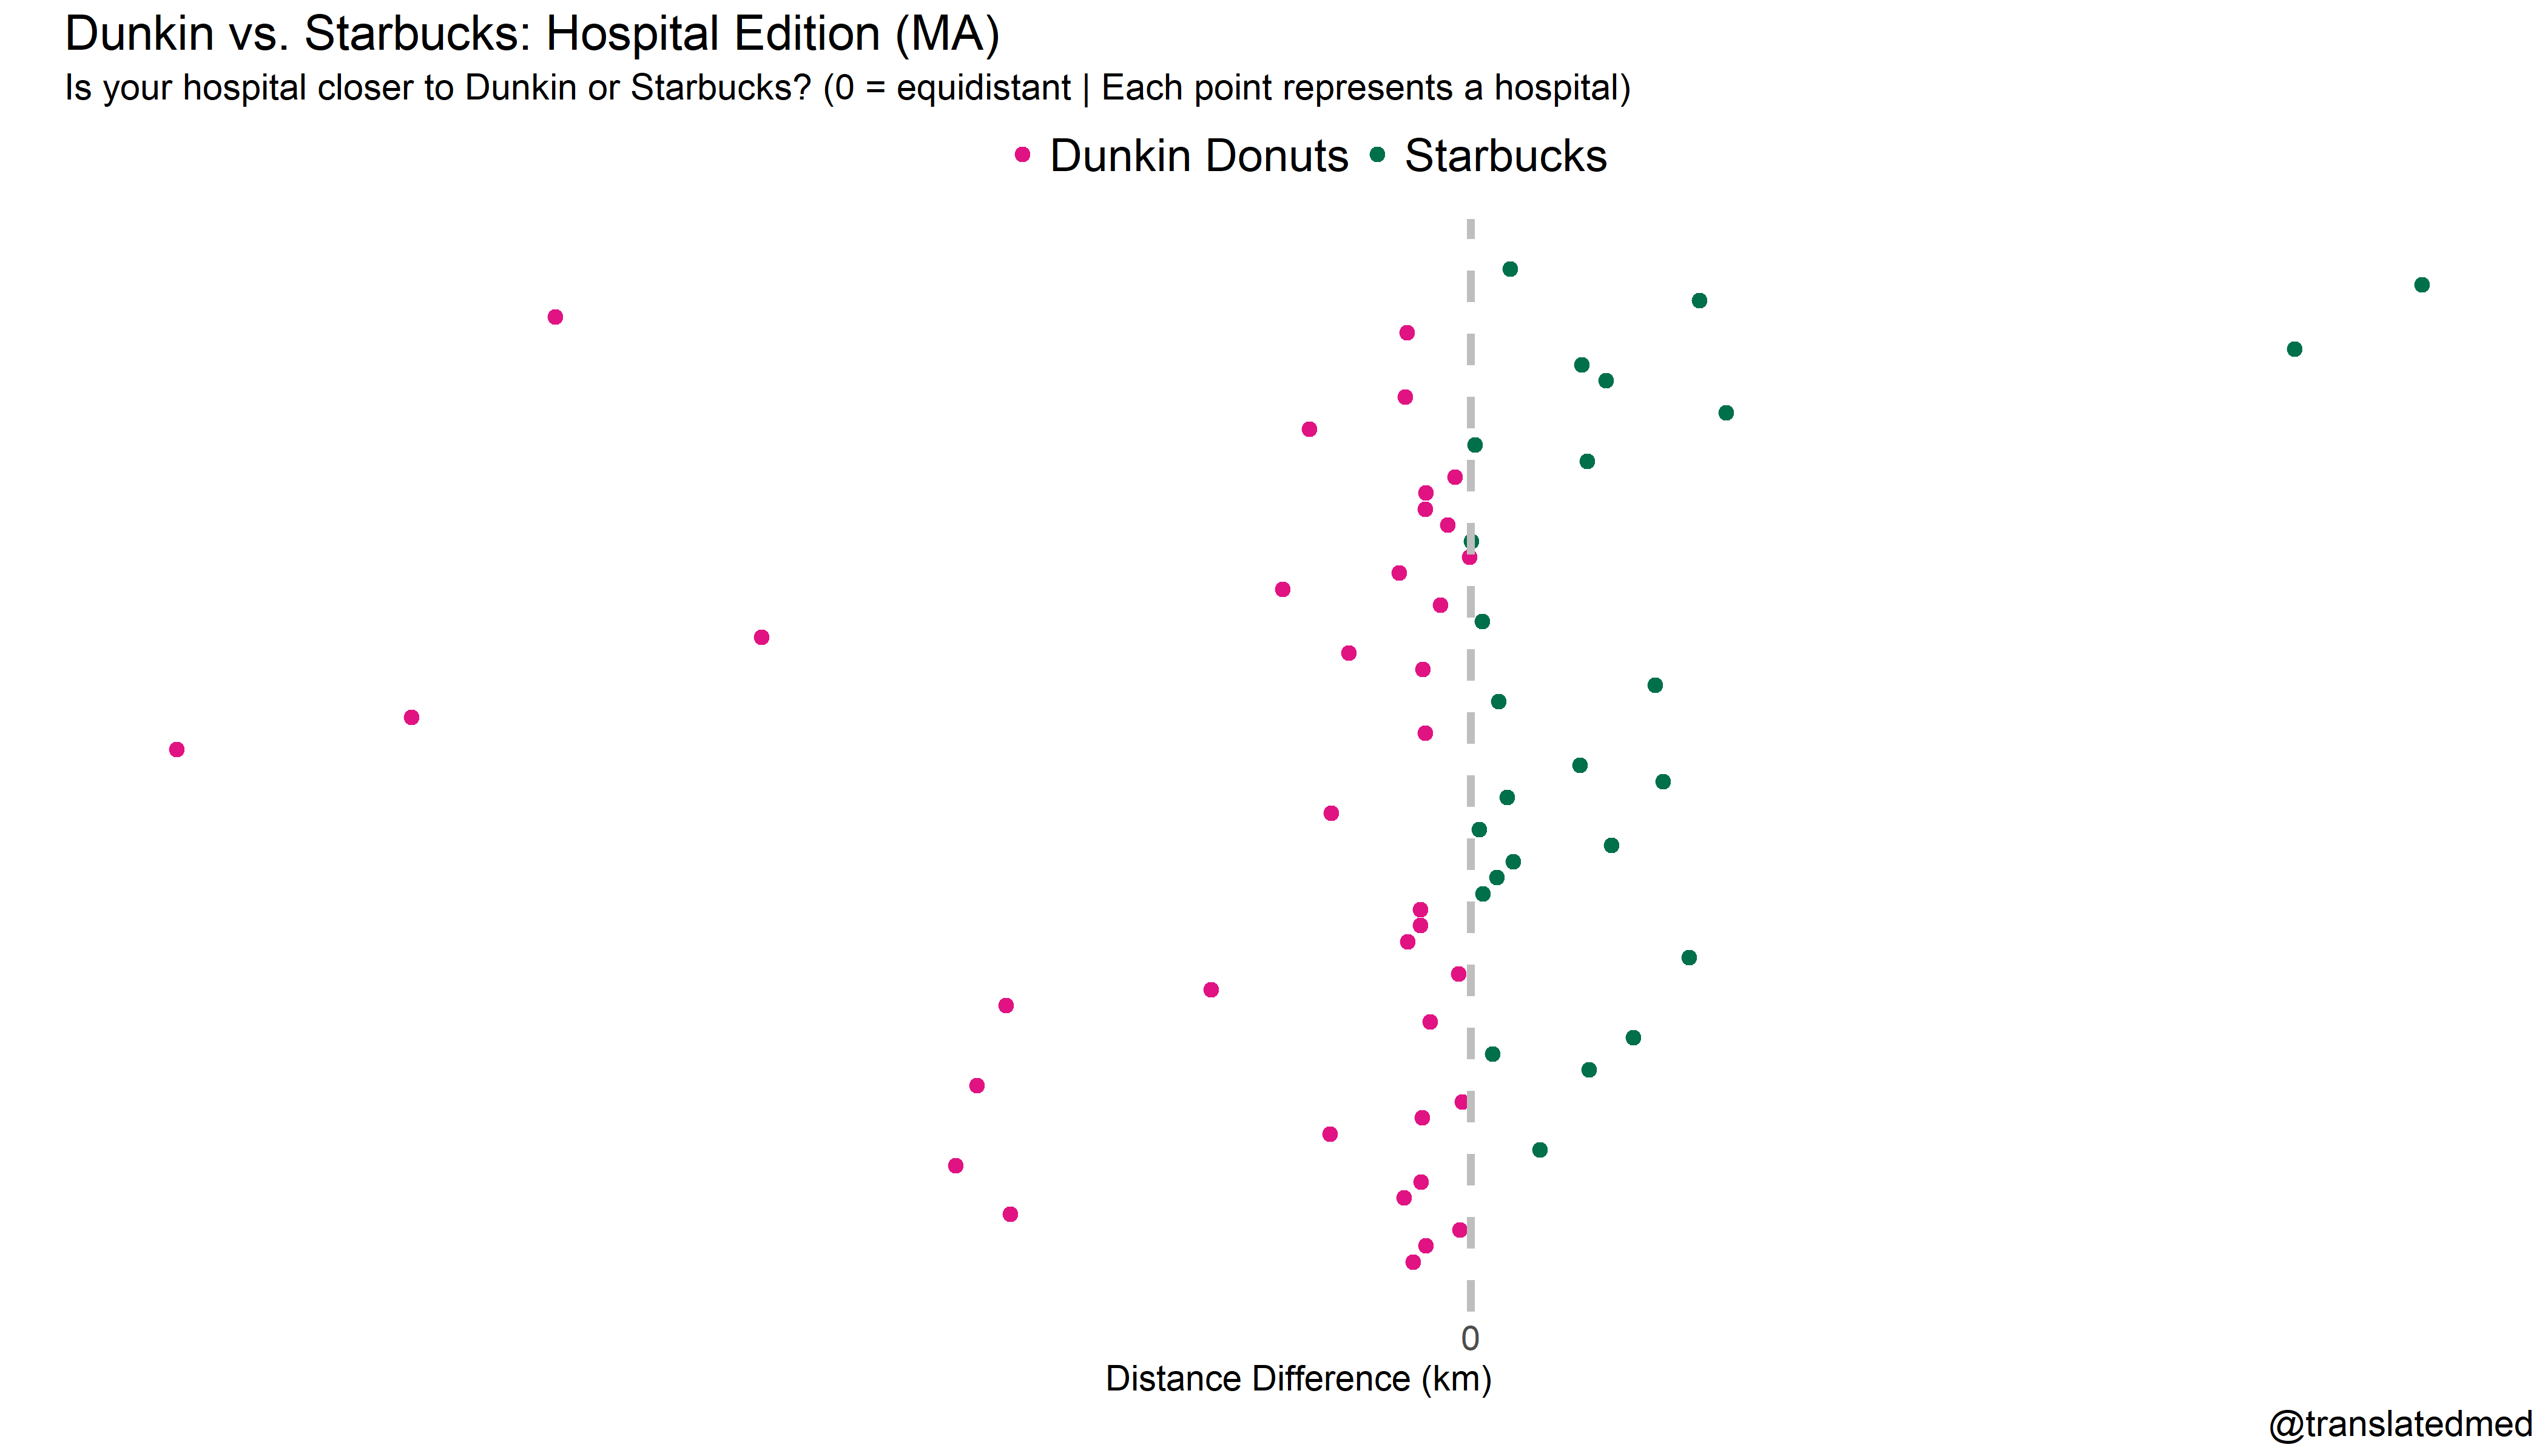
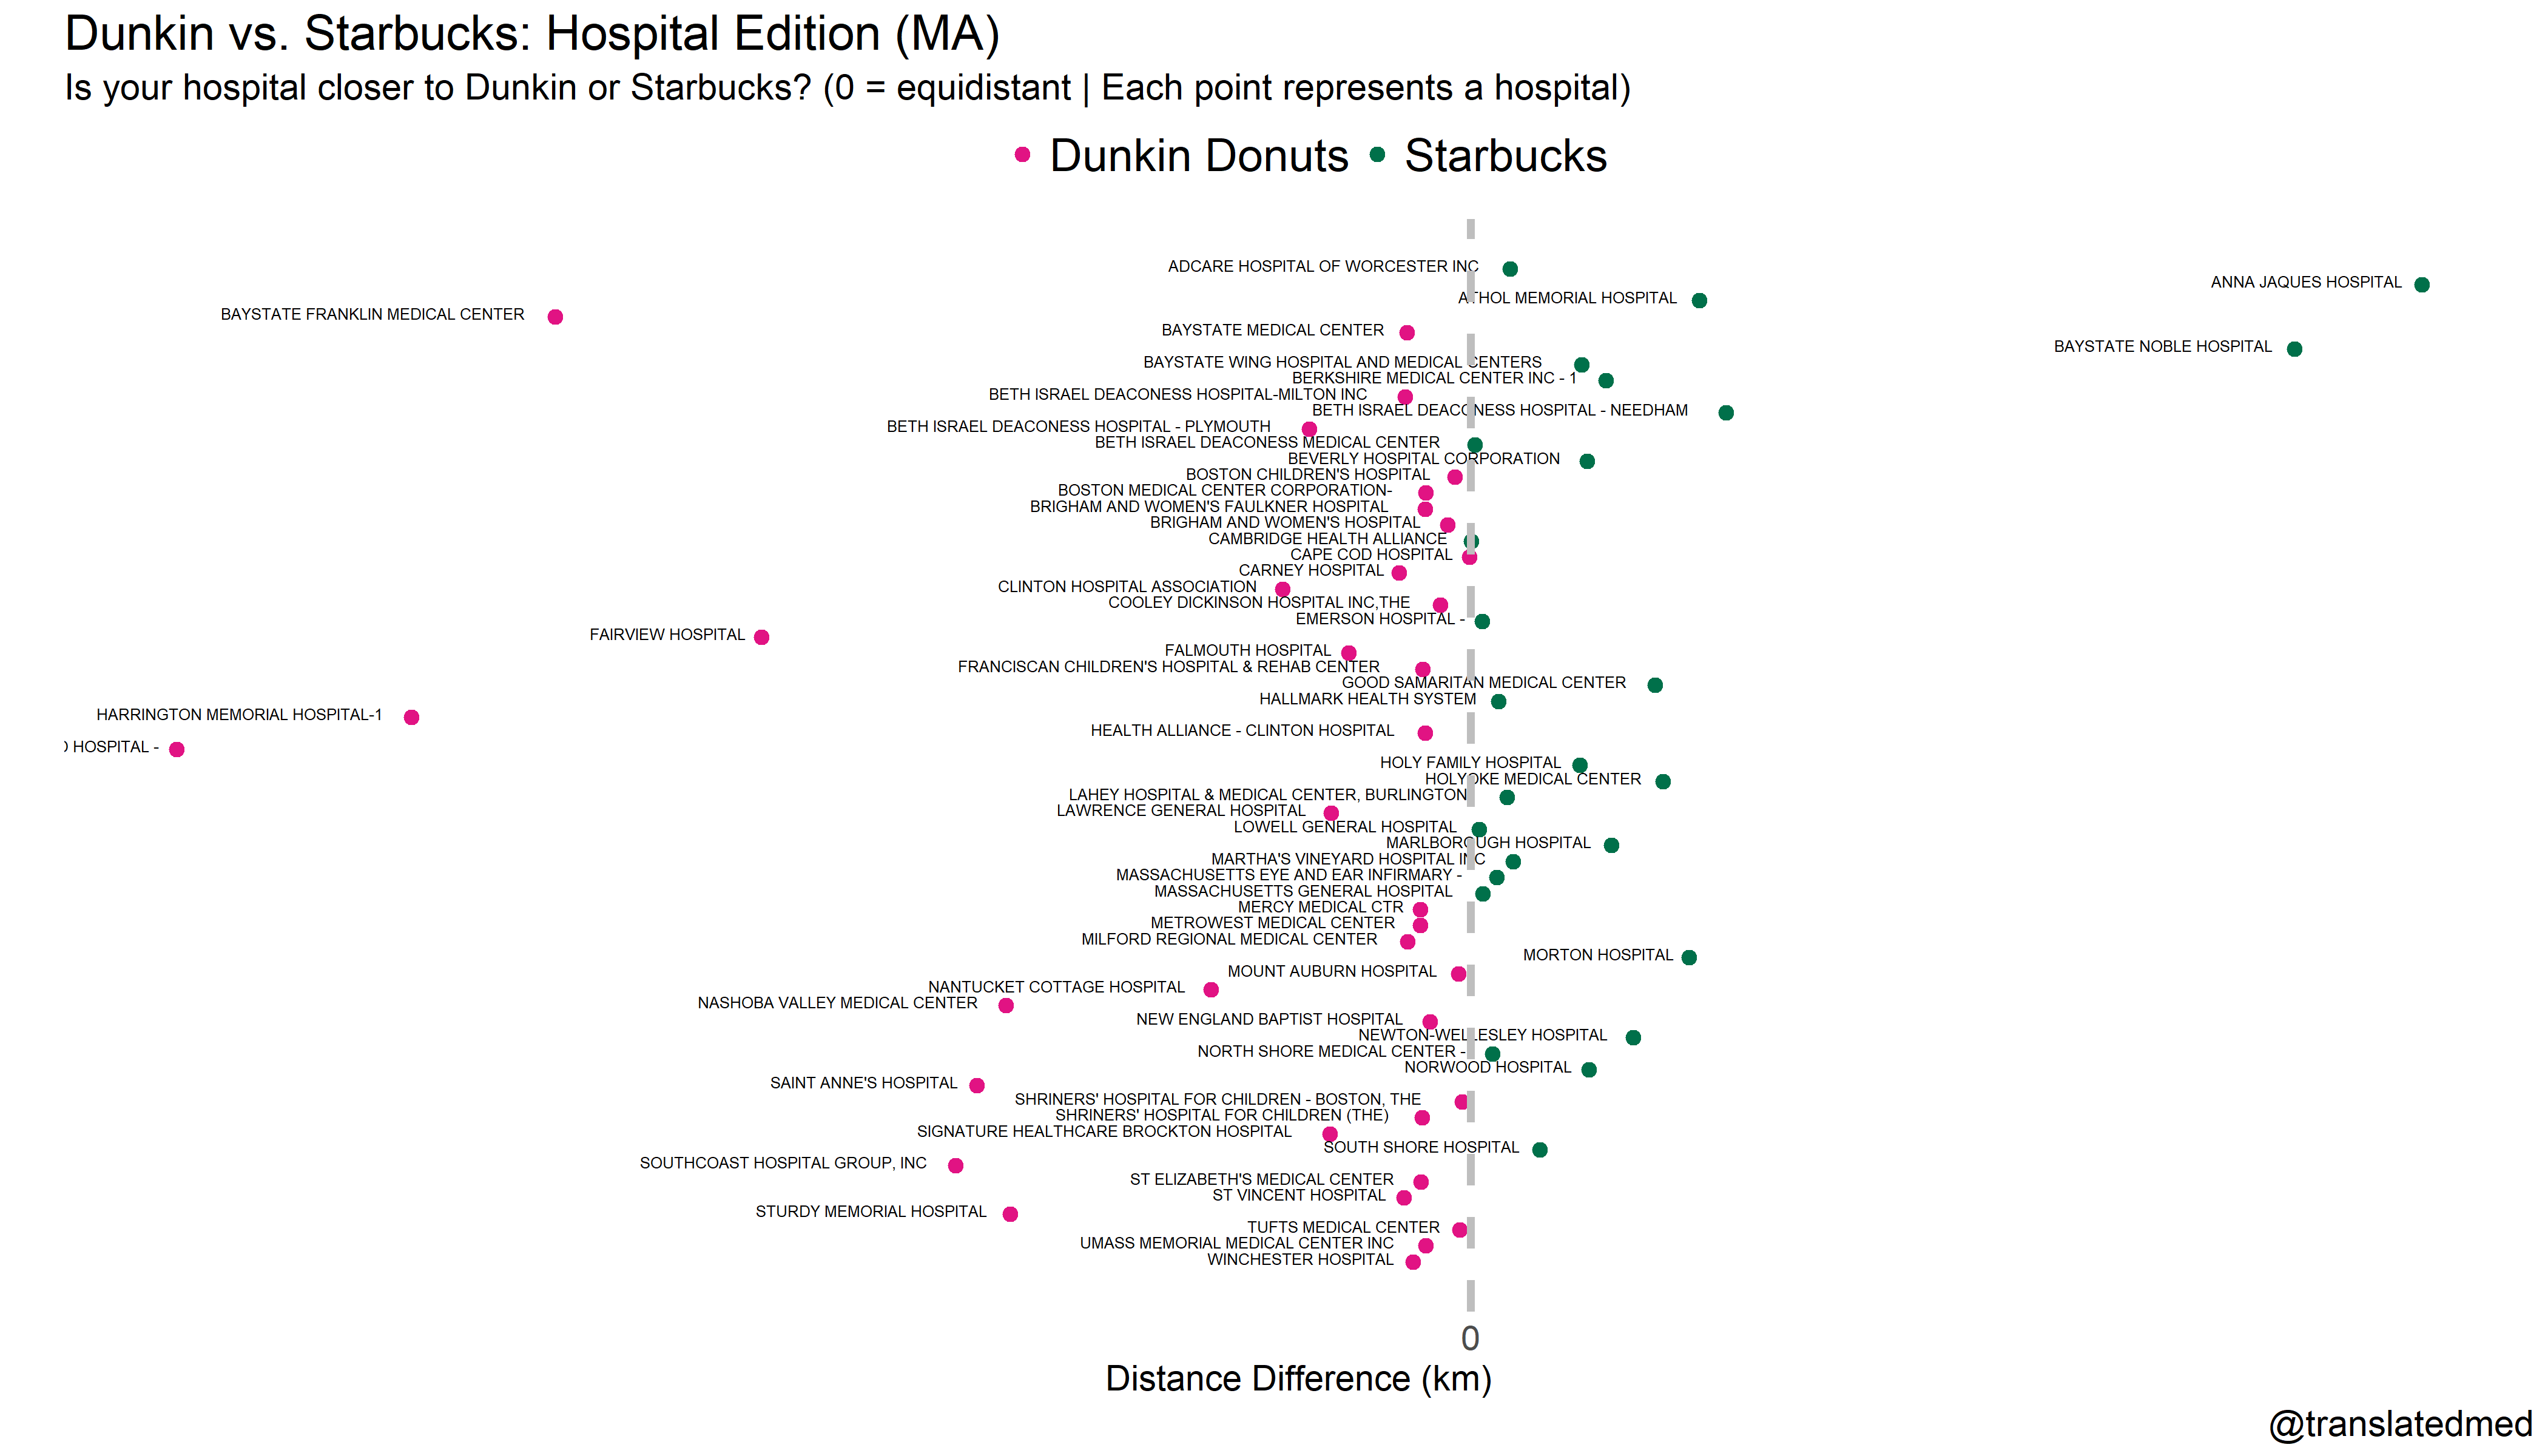
I grouped the data by hospital and chain type (Staburcks or Dunkin). Then I calculated the minimum distance to each chain and chose whether Dunkin or Starbucks was the closest. I finally calcutated the difference between the closest Starbucks and the closest Dunkin to determine, which chain was your best bet for each hospital.
Finally, I plotted the whether the hospital was closer to a Dunkin or Starbucks. As a caveat, there are 273 Starbucks in MA and 497 Dunkin in MA, so Dunkin has an advantage.
final_df %>% filter(!is.na(dist)) %>% group_by(hospName, type) %>% summarize(t = min(dist)) %>%
  spread(type, t) %>% mutate(diff = dunkin - starbucks) %>% mutate(k =diff/1000) %>%
  mutate(winner = if_else(diff < 0, "dunkin", "starbucks")) %>%
  arrange(hospName) %>%
  ggplot(aes(k, desc(hospName), label=hospName, color = winner)) + geom_point(size=2.5) + theme_minimal() +
  scale_color_manual(values = c("#E11383", "#00704a"),
                     labels=c("Dunkin Donuts", "Starbucks"),
                     name = "") +
  scale_x_continuous(labels = c("0"), breaks = c(0)) +
  #geom_text(hjust=1.1, vjust=0.2, size=2.2, color="black") +
  theme(axis.title.x = element_text(size = 14),
        axis.text.x = element_text(size = 14),
        axis.text.y = element_blank(),
        title = element_text(size=16)) +
  theme(panel.grid = element_blank()) +
  theme(legend.position = "top",
        legend.text = element_text(size=18)) +
  geom_vline(xintercept=0, color="gray", linetype="dashed", size=1.5) +
  labs(y="", x="Distance Difference (km)", title = "Dunkin vs. Starbucks: Hospital Edition (MA)",
       subtitle = "Is your hospital closer to Dunkin or Starbucks? (0 = equidistant | Each point represents a hospital)",
       caption="@translatedmed")